01 · Home
Your whole trading day, on one screen.
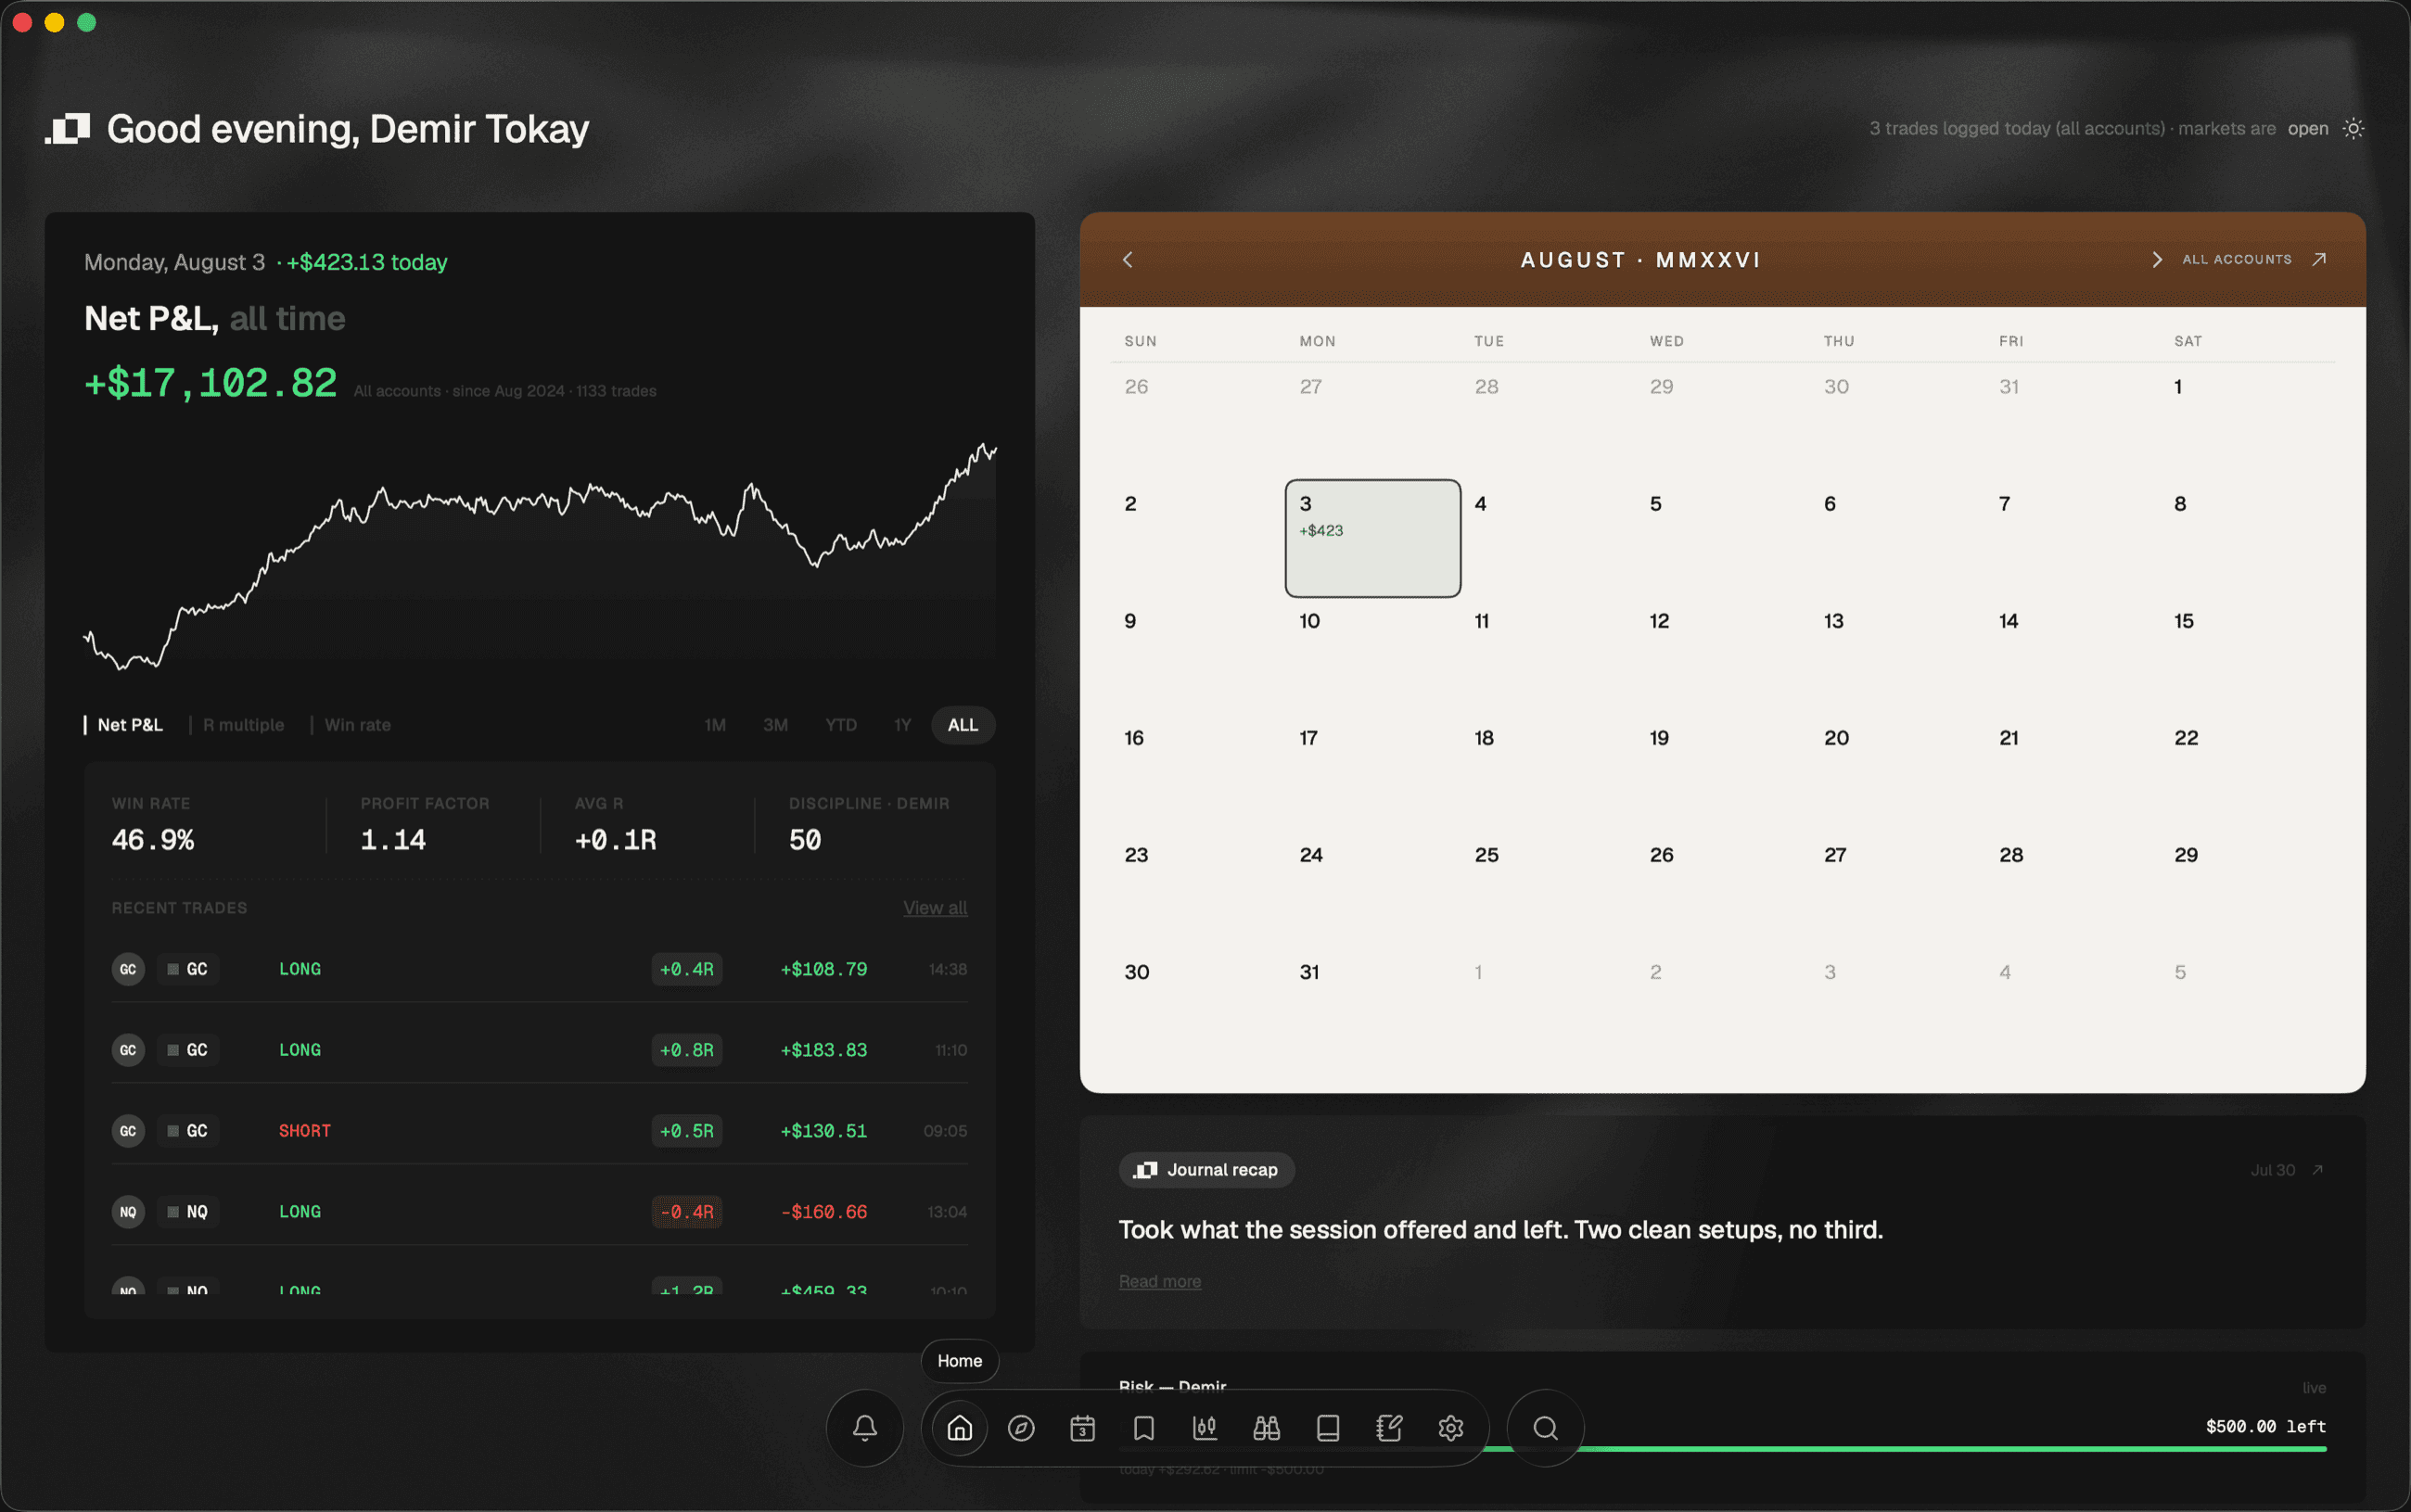
All-time net P&L over a living equity curve, the month on cream paper, what your own journal has been telling you, and how much daily-loss buffer is left. No tabs.
- Net P&L hero
- Equity curve
- KPI row
- Profit calendar
- Recent trades
- Journal recap
- Live risk buffer
- Market hours
- News feed
The month, on paper.
The calendar is the only cream surface in the application, and it is the one you read fastest. Every day that traded carries what it made or lost — Monday the 3rd is +$423.13 across 3 trades — and today is the square with the outline around it. The rest are blank because nothing was traded on them.
It reads your journal back to you.
The recap is built from your own entries and your adherence to your own rules, not from a template — “The checklist works. Took what the session offered and left. Two clean setups, no third” — and it links to the day that proves it. Under it the risk card counts down live: $500.00 of daily-loss buffer left, today +$0.00 against a −$500.00 limit.
When the markets you track open next.
Four tracked markets, each with its next open — Nasdaq and S&P futures on CME Globex, BIST 100 on Borsa Istanbul, DAX on Eurex. On a Friday evening it says the only useful thing there is to say: no tracked markets open in the next 12 hours.
Search from anywhere.
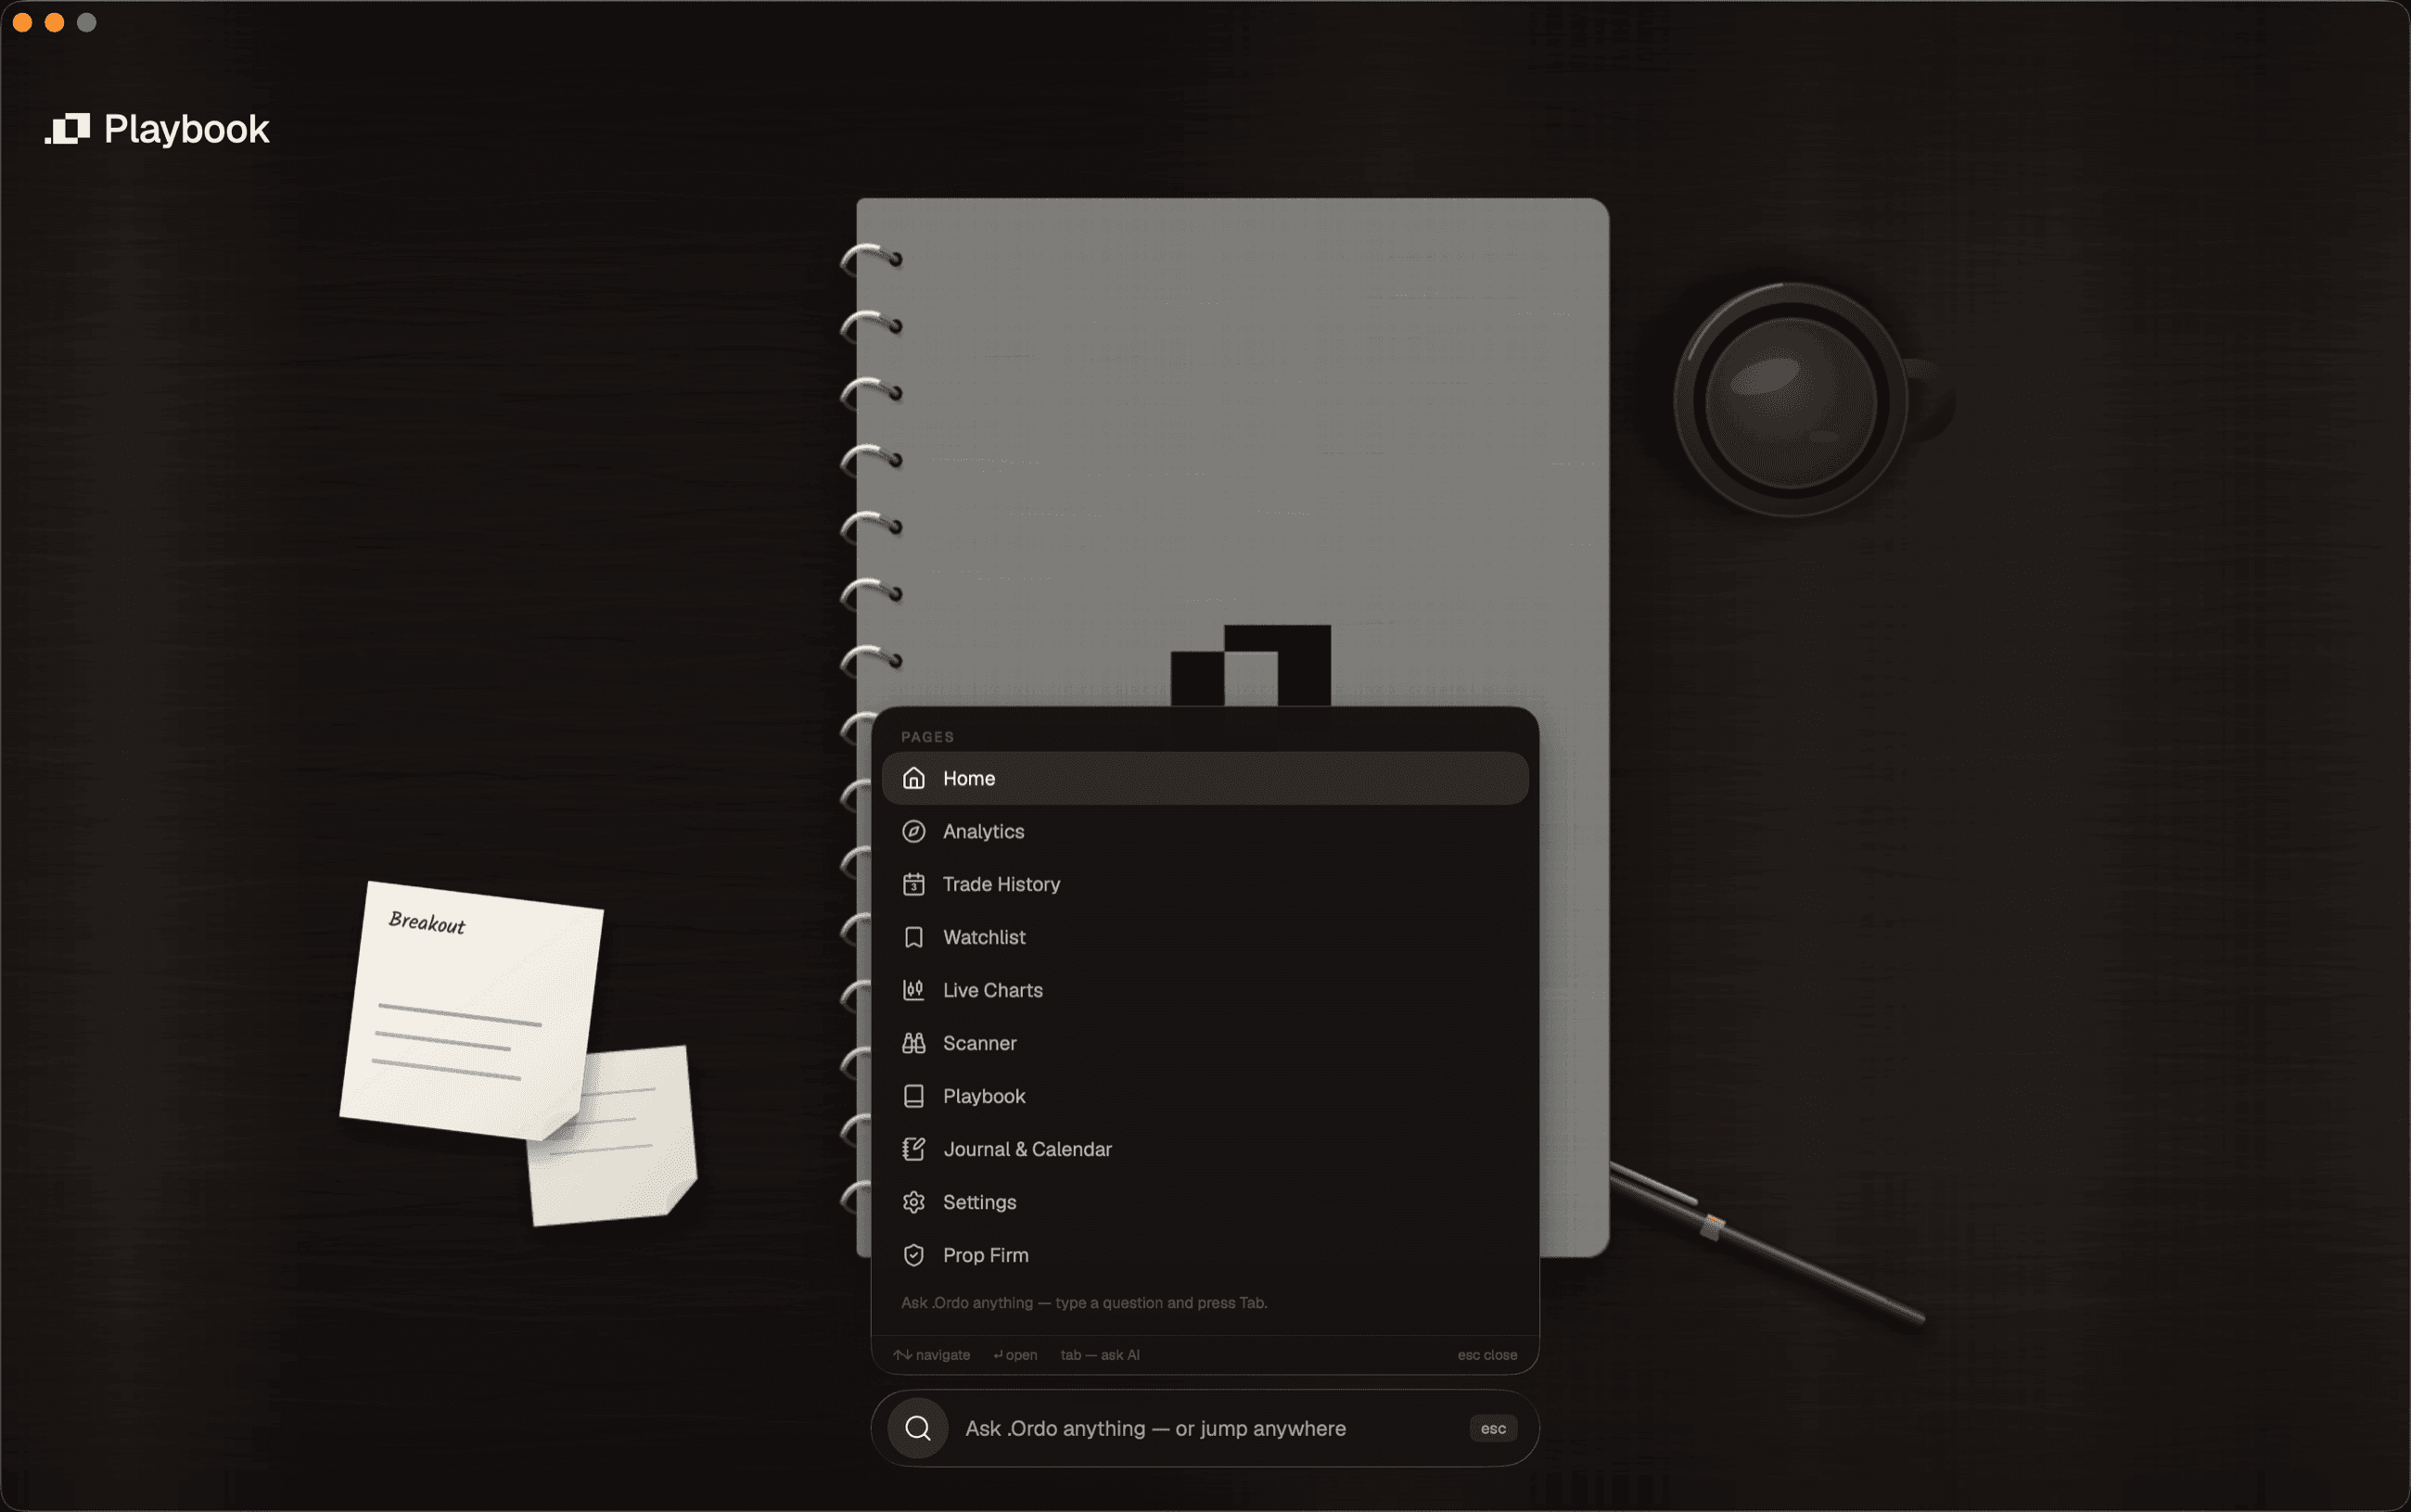
One keystroke opens the command palette over whatever page you were on: your trades with their P&L, your symbols, and quick actions like “Open settings: Data & Backup”. Nothing navigates until you pick something.
Screens are from the current desktop build. The figures in them are a demo journal of 816 trades, not a real account.
STATUS · 3 AUGUST 2026 — Checkout is open. The Windows and macOS installers are not.