05 · Live Charts
A full charting desk, inside your journal.
Real-time candles with a proper drawing toolbox, an indicator pane and price alerts — market context living in the same window as the notes you take about it.
- 1m to weekly
- Volume & indicators
- Drawing toolbox
- Saved per symbol
- Price alerts
- Watchlist panel
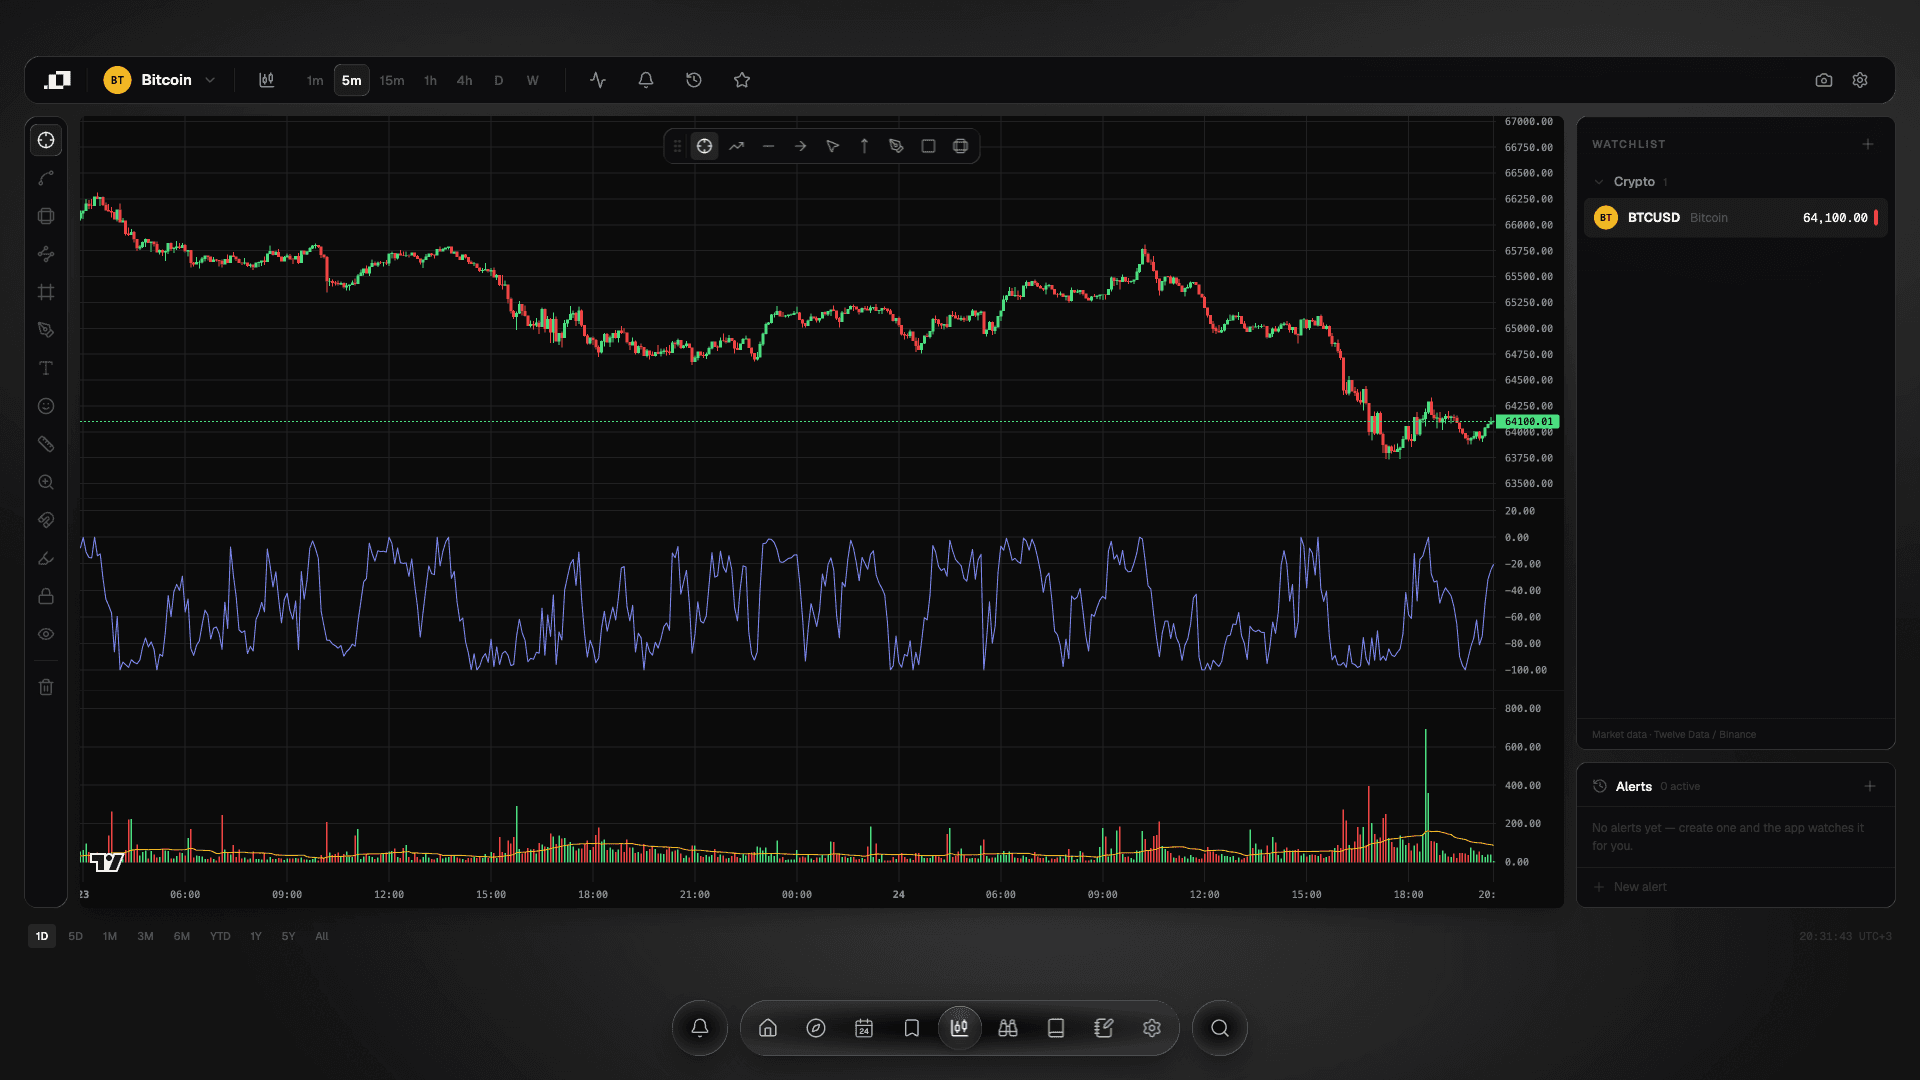
Real candles, real time.
1m, 5m, 15m, 1h, 4h, daily and weekly, with an oscillator and volume stacked on the same time axis. Timeframes switch instantly, and the range row underneath runs from 1D to All.
Draw on it. It remembers.
Trendlines, rays, boxes, brushes, text and measures on the left rail, with the drawing bar floating over the candles themselves. Drawings are saved per symbol, so the level you marked in March is still there in July.
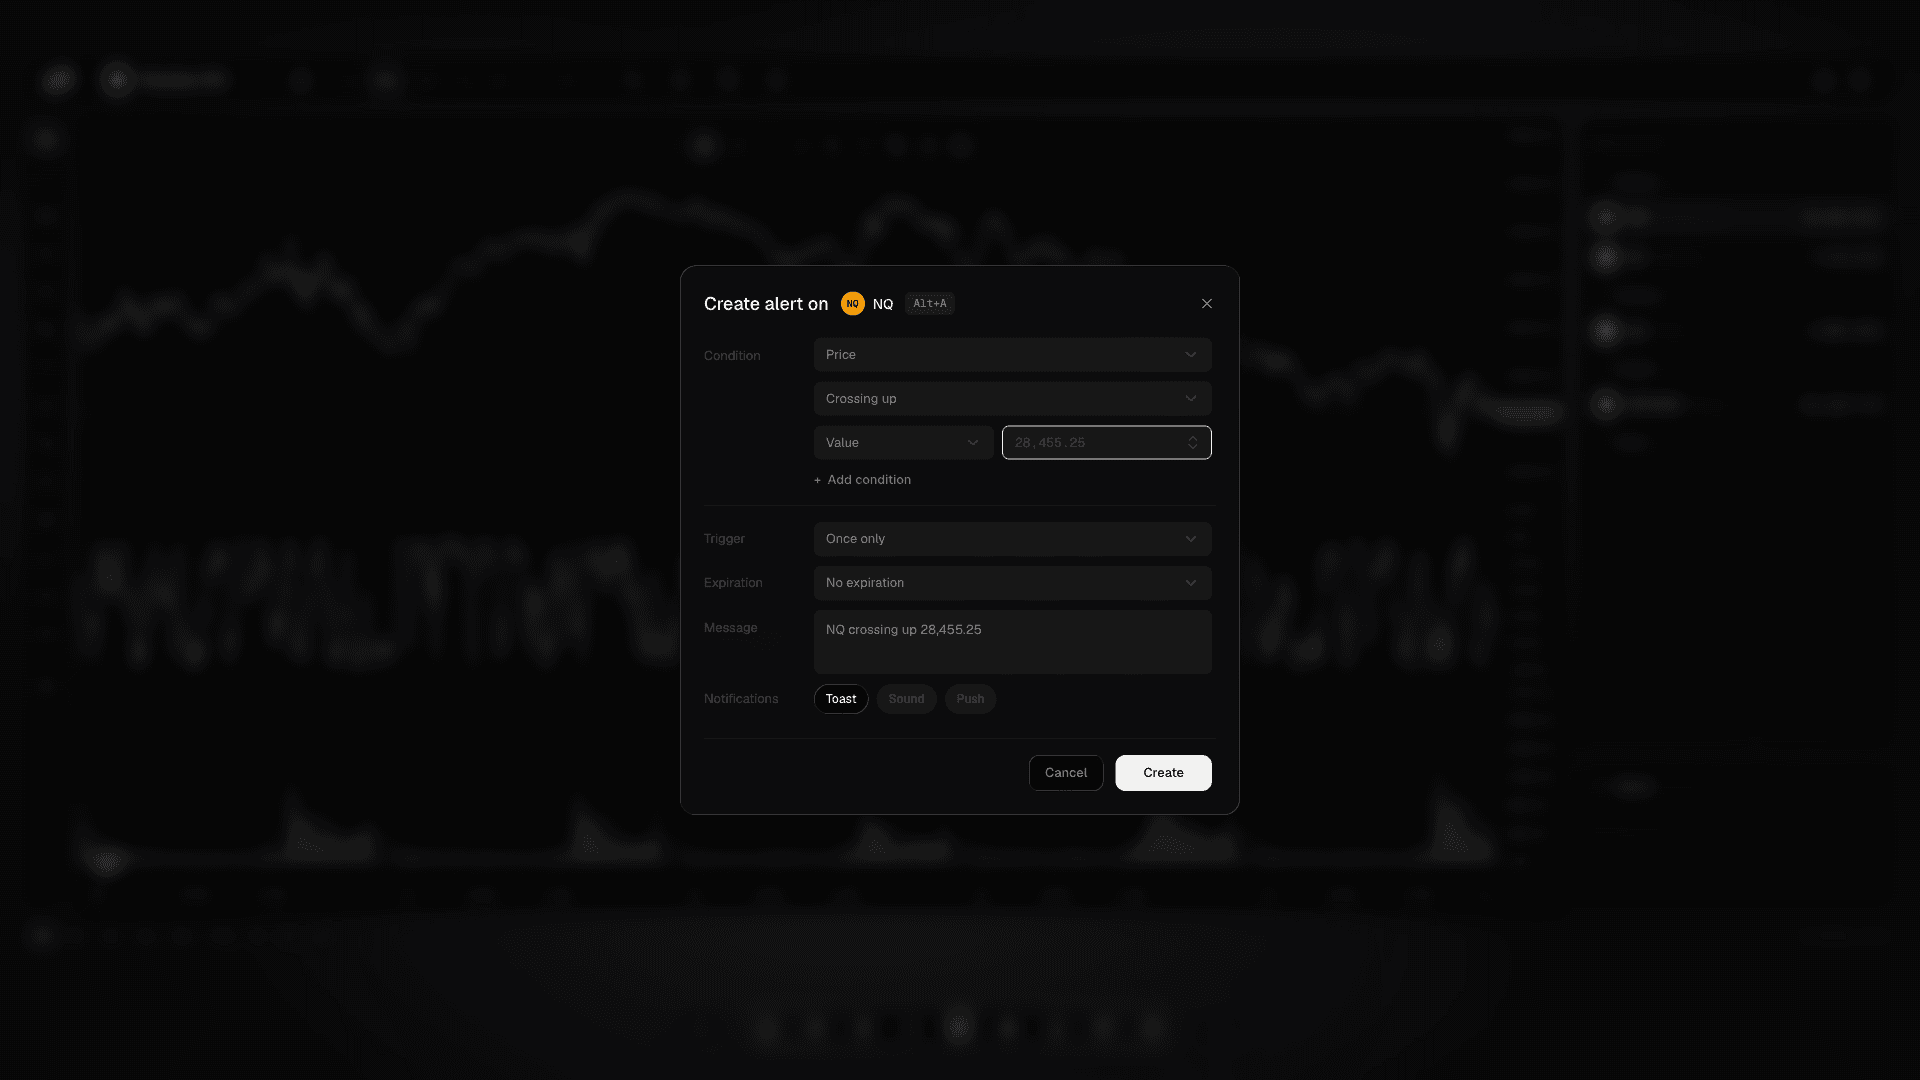
Alerts, in one Alt+A.
Create alert on NQ: price crossing up 28,455.25, trigger once, no expiration — delivered as a toast, a sound or a push. The app watches the level so that you do not have to sit in front of it.
Screens are from the current desktop build. The figures in them are a demo journal of 816 trades, not a real account.
STATUS · 3 AUGUST 2026 — Checkout is open. The Windows and macOS installers are not.